


My experience
This week, I was facing huge lag in one of my Kafka topic. The consumer was facing issues in committing the messages (Something similar to stackoverflow.com/questions/50135591/kafka-..), and I was left wondering how I can resolve this at priority. What helped me out was Elastic APM.
I checked the metrics of the transaction that was handled by my consumer, and found it was taking more than 5 minutes, which was the default timeout session of a Kafka consumer, causing the consumer to be kicked out of the consumer group due to unresponsiveness.

The transaction showed that there was a methods that was being called in loop that was spiking the latency,

which when resolved resulted in resolving the lag as well.
This blog will guide you through leveraging Elastic APM metrics to pinpoint bottlenecks and enhance your application's efficiency, just like I did!
What is Elastic APM?
Elastic APM is a part of the Elastic Stack that helps developers and operations teams gain real-time insights into application performance. It tracks key metrics, such as response times, error rates, throughput, and system resource usage. These metrics are crucial for identifying performance bottlenecks and optimizing your application.
You can refer to the documentation here:
https://www.elastic.co/observability/application-performance-monitoring
Setting Up Elastic APM
Install and Configure the APM Server: Elastic APM Server is the central component that collects data from APM agents and sends it to Elasticsearch.
 docker pull docker.elastic.co/apm/apm-server:8.10.2
 docker run -d --name=apm-server \
   -e ELASTICSEARCH_HOSTS=http://localhost:9200 \
   -e KIBANA_HOST=http://localhost:5601 \
   -p 8200:8200 \
   docker.elastic.co/apm/apm-server:8.10.2
Install the APM Agent: Choose an APM agent compatible with your application’s language. For example, to install the Java agent:
 java -javaagent:/path/to/elastic-apm-agent.jar \
   -Delastic.apm.service_name=my-service \
   -Delastic.apm.server_urls=http://localhost:8200 \
   -Delastic.apm.environment=production \
   -Delastic.apm.secret_token=YOUR_SECRET_TOKEN \
   -Delastic.apm.application_packages=com.myapp \
   -jar myapp.jar
Verify the Setup: Open the Kibana interface and navigate to APM. You should see your service listed, along with metrics and traces.
Key Metrics to Monitor
1. Transaction Duration
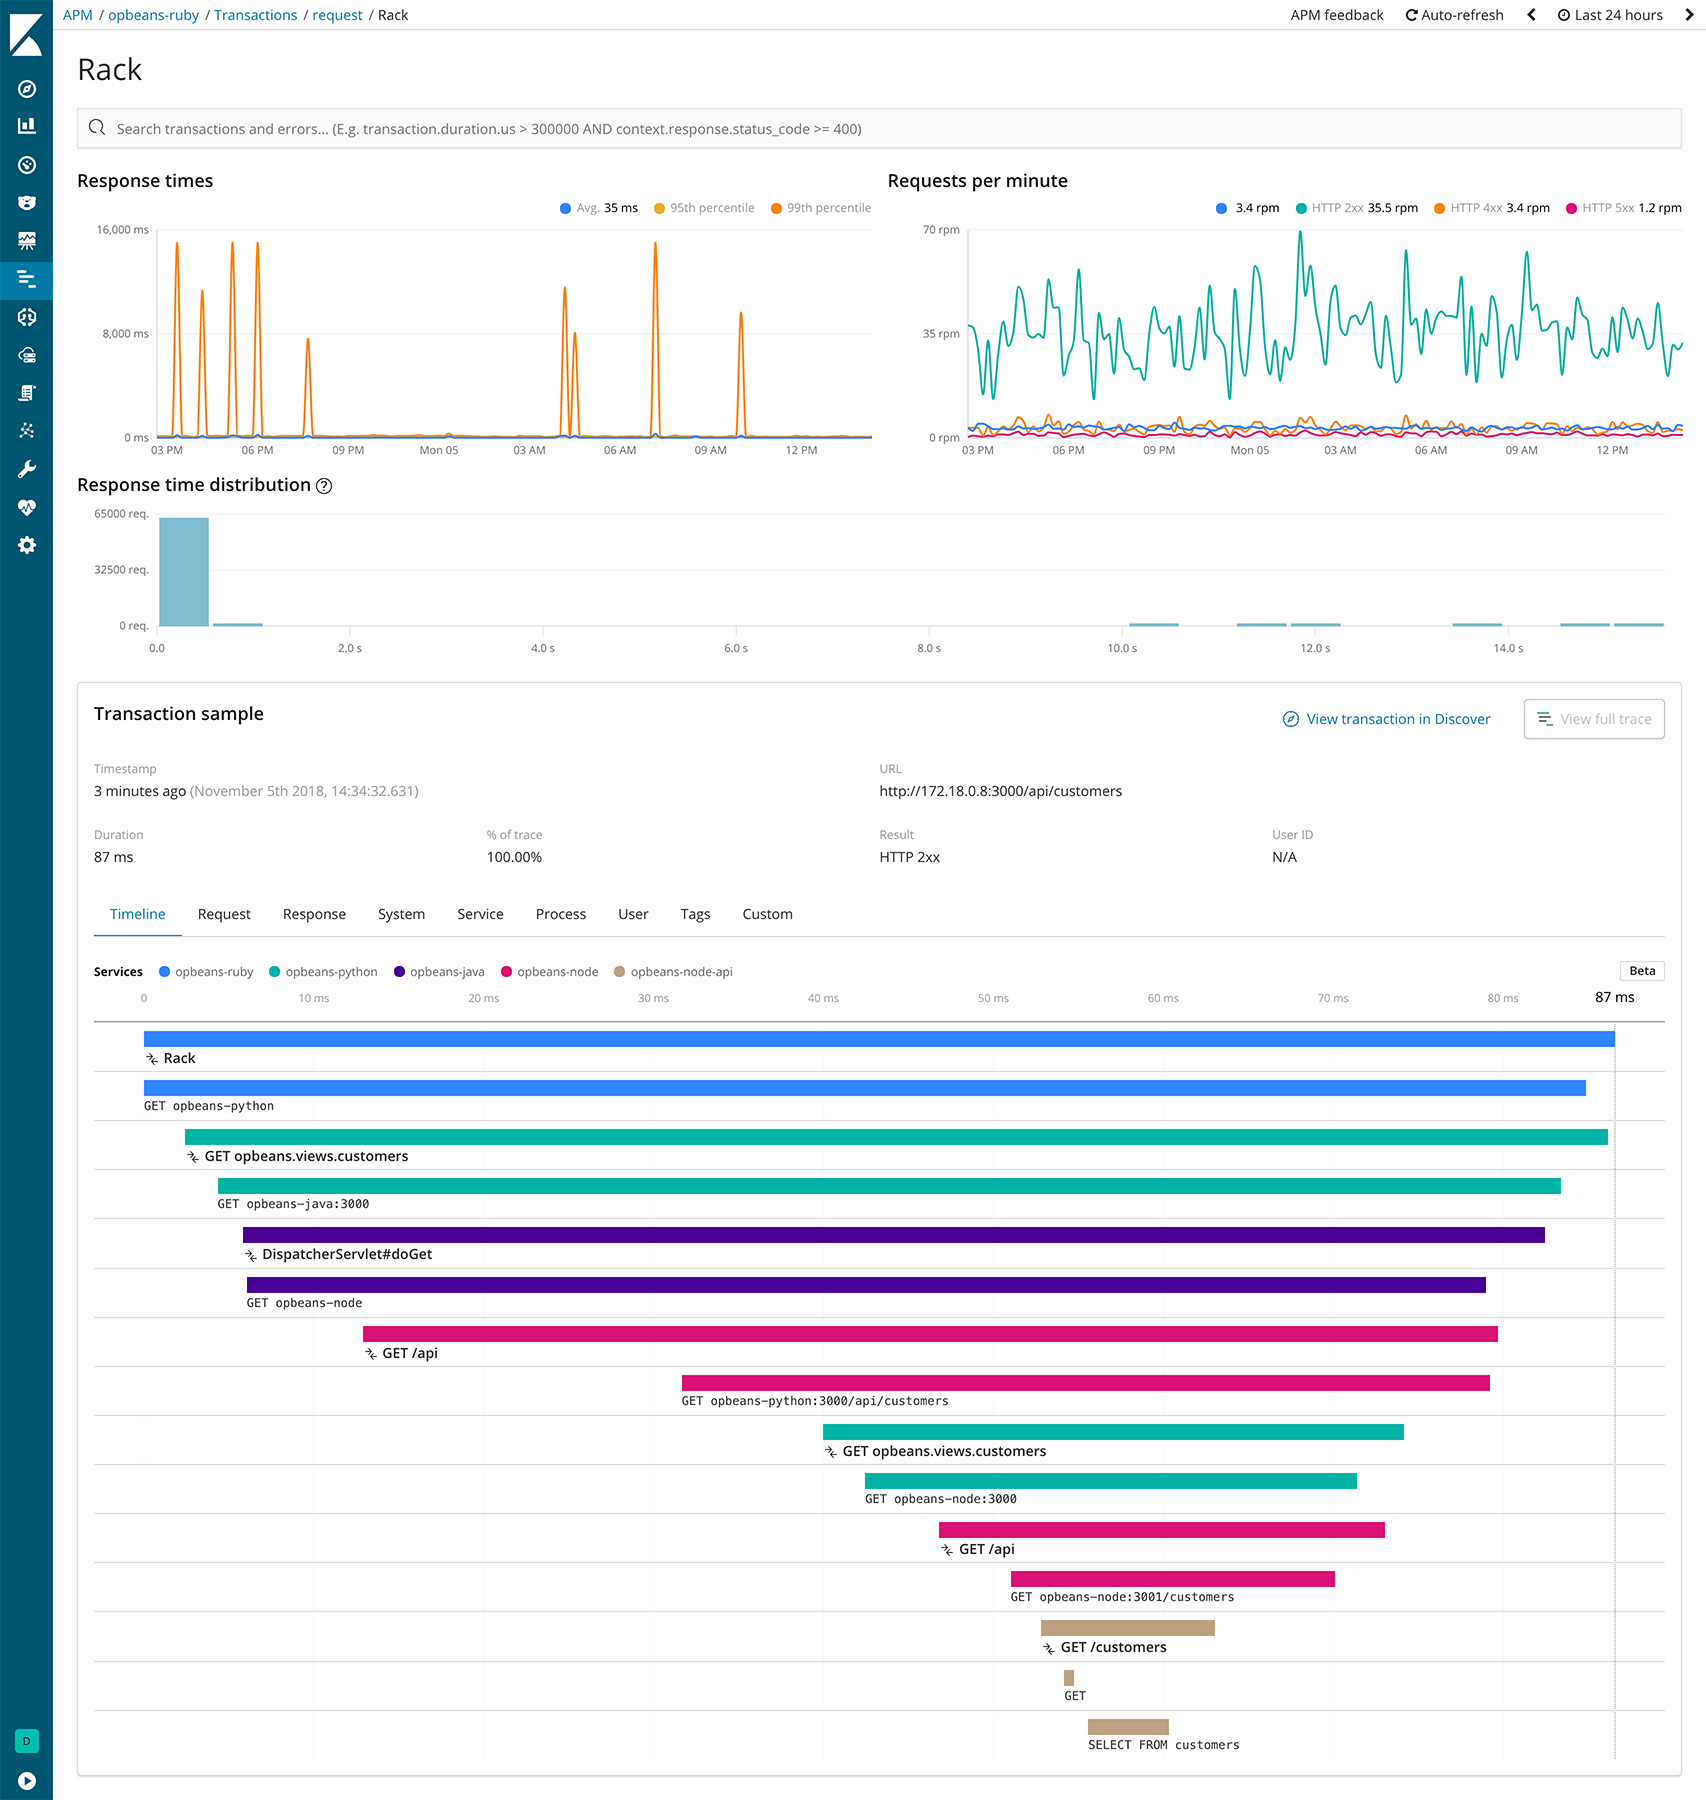
This metric helps identify slow transactions in your application. Look for transactions with the highest duration to identify potential bottlenecks.
Example: A slow checkout process in an e-commerce app.
2. Error Rates
Monitor error rates to detect any unexpected issues. High error rates often indicate bugs or resource limitations.
Example: Frequent 500 errors in an API endpoint.

3. Throughput
Throughput indicates the number of requests your application handles over time. Use this to ensure your infrastructure scales with demand.
Example: A spike in user signups during a marketing campaign.

4. System Metrics
Elastic APM also provides system-level metrics such as CPU, memory, and disk usage. Use these metrics to identify resource constraints.
Example: High memory usage causing slow application responses.

Optimizing Application Performance
Identify Slow Transactions:
Use the Transaction Duration metric to locate the slowest endpoints or processes.
Analyze the trace waterfall to pinpoint delays.
Fix Error-Prone Areas:
Investigate high-error-rate endpoints.
Use stack traces and logs to debug issues.
Scale Infrastructure:
Use the Throughput and System Metrics to determine if your servers need scaling.
Configure auto-scaling policies based on these insights.
Optimize Database Queries:
Look for slow queries in the trace data.
Use query optimization techniques or caching to reduce load.
Monitor Performance Continuously:
Set up alerts for key metrics.
Regularly review performance dashboards in Kibana.
Commands to Generate Visualizations
Create a Saved Search in Kibana:
curl -X POST "http://localhost:5601/api/saved_objects/search" \
  -H "Content-Type: application/json" \
  -H "kbn-xsrf: true" \
  -d '{
    "attributes": {
      "title": "Slow Transactions",
      "query": {
        "query": "transaction.duration.us > 1000000",
        "language": "kuery"
      }
    }
  }'
Generate a Dashboard:
curl -X POST "http://localhost:5601/api/saved_objects/dashboard" \
  -H "Content-Type: application/json" \
  -H "kbn-xsrf: true" \
  -d '{
    "attributes": {
      "title": "Performance Overview",
      "panelsJSON": "[...panel configurations...]"
    }
  }'
Conclusion
Elastic APM is a powerful tool for monitoring and optimizing your application's performance. By analyzing key metrics like transaction duration, error rates, and system resource usage, you can proactively address issues and ensure your application scales with demand.
Start leveraging Elastic APM today to provide your users with a seamless experience!